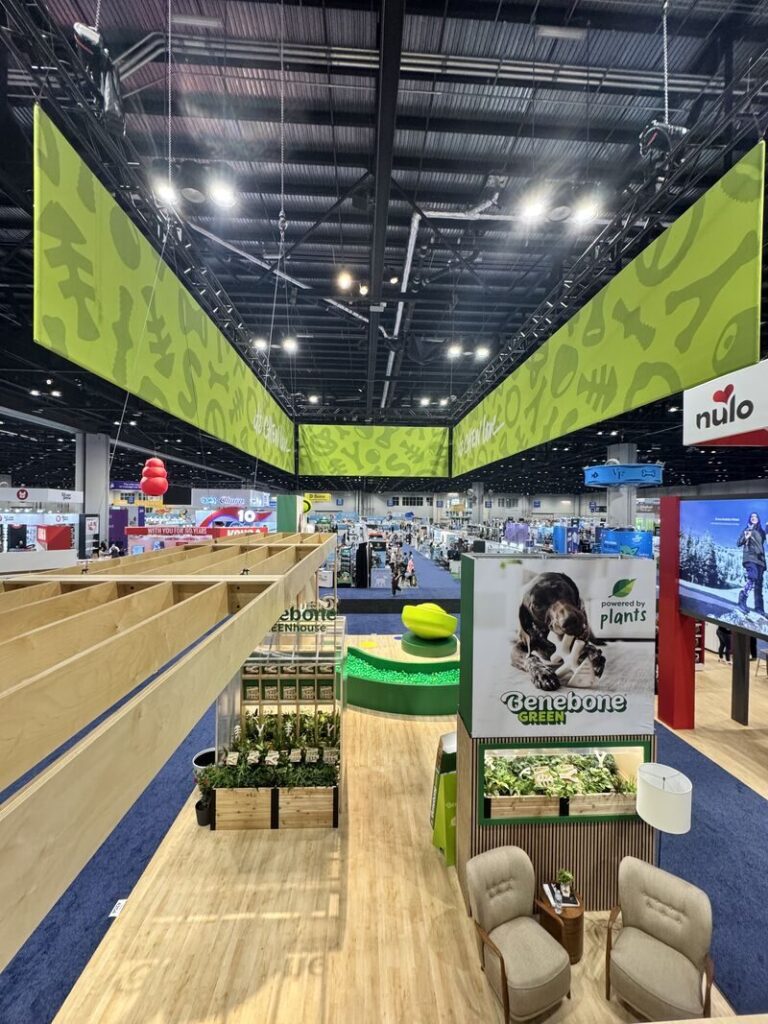
pet trade shows: for Exporters: Strategic Participation Guide
Pet industry trade shows generate over $500 million in annual transaction volume, connecting manufacturers with distributors, retailers, and partners across global markets. For exporters seeking international market access, trade shows provide concentrated exposure to potential partners that would require months of individual outreach to replicate. Yet trade show participation is expensive — a single major show investment ranges from $15,000 to $100,000 depending on booth size, location, and support requirements — and poorly planned participation wastes this investment on low-value interactions that never convert to business. This guide provides the strategic framework for maximizing trade show ROI for pet product exporters.
Pet Trade Shows
The Trade Show Landscape for Pet Exporters
Major International Pet Trade Shows
| Show | Location | Frequency | Scale | Best-Fit Exhibitors | Key Attendee Types |
|---|---|---|---|---|---|
| Global Pet Expo | Orlando, USA | Annual | ~1,000 exhibitors, ~10,000 attendees | Manufacturers targeting US market | US retailers, distributors, media |
| Interzoo | Nuremberg, Germany | Biennial (even years) | ~2,000 exhibitors, ~40,000 attendees | Global manufacturers targeting EU and international | International distributors, retailers, buyers |
| Pet Fair Asia | Shanghai, China | Annual | ~800 exhibitors, ~30,000 attendees | Manufacturers targeting China/Asia | Chinese distributors, e-commerce platforms, retailers |
| Pet Expo Australia | Sydney, Australia | Annual | ~200 exhibitors, ~5,000 attendees | Manufacturers targeting Australia/NZ | Australian retailers, distributors |
| Pet Business Expo | Warsaw, Poland | Annual | ~300 exhibitors | Eastern European market entry | Eastern European distributors, retailers |
| Zoomark | Bologna, Italy | Biennial (odd years) | ~600 exhibitors, ~25,000 attendees | Premium brands targeting EU | European distributors, specialty retailers |
| SuperZoo | Las Vegas, USA | Annual | ~500 exhibitors, ~8,000 attendees | US market accessories and treats | US independent retailers, groomers |
| Pet Fair Southeast Asia | Bangkok, Thailand | Annual | ~300 exhibitors | SE Asia market entry | SE Asian distributors, e-commerce |
Show Selection Decision Framework
Choose shows based on strategic alignment, not habit or convenience:
- Target market alignment: Select shows where your target market buyers congregate; Global Pet Expo for US market access, Interzoo for European and international, Pet Fair Asia for China
- Category relevance: Some shows emphasize specific categories; SuperZoo for accessories and grooming, Interzoo for comprehensive product range
- Attendee quality: Evaluate attendee composition; shows attracting buyer decision-makers (distributors, retail chain buyers) produce higher ROI than shows attracting general industry observers
- Competitive presence: Consider whether your competitors exhibit; their presence means your absence creates a visibility gap; their absence may signal low show ROI for your category
- Cost-benefit assessment: Calculate total participation cost against expected lead value; show ROI must exceed alternative marketing investment ROI
Pre-Show Preparation Strategy
Goal Setting and Metrics
Define measurable objectives before committing participation resources:
| Goal Type | Metric | Target | Tracking Method |
|---|---|---|---|
| Distributor leads | Qualified distributor contacts | 10–30 per show (varies by market) | Lead tracking spreadsheet |
| Retail buyer meetings | Scheduled meetings with target retailers | 5–15 per show | Pre-show appointment scheduling |
| Media coverage | Press mentions and feature articles | 3–5 per show | Media contact tracking |
| Product sampling | Samples distributed to qualified prospects | 200–500 per show | Sample tracking log |
| Market intelligence | Competitive and market observations documented | 10+ actionable insights | Observation notes |
| Partnership discussions | Serious partnership negotiations initiated | 2–5 per show | Meeting notes and follow-up log |
Pre-Show Marketing and Appointment Scheduling
Trade show success begins weeks before the event:
- Pre-show outreach: Contact target distributors, retailers, and media 4–6 weeks before the show requesting meetings; scheduled meetings convert at 5x higher rate than walk-in booth visitors
- Show guide listing: Ensure your company appears in the official show guide and digital attendee platform; searchable listing drives walk-in traffic from attendees seeking your product category
- Social media promotion: Announce participation and showcase objectives on LinkedIn, Instagram, and industry forums; pre-show visibility increases booth traffic
- Email campaigns: Send targeted emails to existing contacts and prospects inviting them to visit your booth; personal invitations generate higher-quality visits than general awareness
- Sample preparation: Prepare professional sample kits with product information, pricing overview, and partnership terms; samples without context create wasted distribution
Booth Design and Materials
- Visual impact: Booth design must attract attention from aisle traffic in 3 seconds; clean, professional design with clear product category signage outperforms cluttered, product-heavy displays
- Product presentation: Display 3–5 flagship products prominently rather than attempting to show entire product line; focused presentation creates clearer brand impression
- Information materials: Professional product catalogs, capability brochures, and partnership term summaries available in booth; digital versions on USB drives or QR-linked pages reduce print cost
- Technology integration: Video screens showing product demonstrations, manufacturing facility tours, or customer testimonials create engagement beyond static display
- Meeting area: Small semi-private meeting area within booth enables substantive conversations away from aisle noise; meeting area converts casual interest to serious discussion
- Branded giveaways: Minimal, professional giveaways (branded notebooks, quality pens) that attendees actually use; cheap promotional items create negative brand impression
During-Show Execution
Lead Qualification and Capture
Not every booth visitor is a genuine business opportunity:
- Qualification questions: Train booth staff to ask five rapid qualification questions: What company? What market/territory? What product categories interest them? Current product assortment? Decision authority level?
- Tier classification: Classify leads immediately: A (decision-maker, active interest, target territory), B (influencer, moderate interest, relevant territory), C (observer, low conversion probability)
- Contact capture system: Use digital lead capture (badge scanner or mobile app) for speed and accuracy; paper forms create data entry delays and errors
- Note attachment: Attach meeting notes and context to every lead record at capture time; post-show note reconstruction loses conversation detail critical for follow-up effectiveness
- Immediate follow-up scheduling: Schedule specific follow-up dates with A-level leads before leaving the booth; scheduling commitment dramatically increases follow-up completion rate
Meeting Management
- Pre-scheduled meetings priority: Honor pre-scheduled meeting times before walk-in visitors; scheduled meetings represent higher-value prospects who made commitment to meet you
- Meeting duration management: Limit meetings to 15–20 minutes; longer meetings consume booth coverage time and rarely produce better outcomes than focused shorter meetings
- Next-step definition: Every meeting should end with a specific next step: “We will send you sample pricing for your territory within 5 business days” rather than “We will follow up soon”
- Competitive intelligence collection: During conversations, collect information about competitive landscape in the prospect’s territory; market intelligence from show conversations provides insight unavailable through other channels
Post-Show Follow-Up
Follow-Up Timeline
| Action | Timeline | Priority | Purpose |
|---|---|---|---|
| A-level lead follow-up email | Within 24–48 hours | Critical | Confirm interest, deliver promised information |
| B-level lead follow-up email | Within 72 hours | High | Maintain engagement, provide product information |
| Sample/pricing shipment | Within 5 business days | Critical | Deliver on meeting commitments |
| Meeting summary distribution | Within 3 business days | High | Confirm understanding and next steps |
| C-level lead follow-up | Within 1 week | Medium | General information distribution |
| Partnership proposal submission | Within 2 weeks | High (A-level only) | Advance serious partnership discussions |
| Show ROI calculation | Within 1 month | High | Evaluate participation value for future decisions |
Lead Conversion Tracking
- Pipeline tracking: Track every show lead through sales pipeline stages: initial contact → qualification → proposal → negotiation → close; pipeline tracking reveals show ROI over extended timeline
- Conversion rate measurement: Calculate ultimate conversion rate (closed deals ÷ total qualified leads); typical pet trade show conversion rates range from 5–15% for distributor partnerships
- Revenue attribution: Attribute revenue from show-originated partnerships back to show investment; show ROI emerges over 12–24 months as partnerships develop
- Cost-per-lead comparison: Calculate cost per qualified lead (total show investment ÷ qualified leads captured) and compare against alternative lead generation methods; show cost-per-lead typically $100–$500 depending on show and category
Show Participation for Different Exporter Types
OEM Manufacturer Exhibition Strategy
OEM factories exhibit to attract brand clients seeking manufacturing partnerships:
- Capability emphasis: Booth and materials must emphasize production capability, quality certifications, and technical expertise; OEM exhibition is a B2B service presentation, not consumer product display
- Reference credibility: Highlight existing client brands (with permission) and quality certifications; OEM buyers evaluate factory credibility through existing client quality signals
- Sample diversity: Display production capability breadth through varied product format samples (extruded, baked, wet, treats); capability breadth attracts clients with diverse product line needs
- Technical staff availability: Have formulation and production engineers available for technical discussions; OEM buyers expect engineering-level conversations, not sales-level presentations
Brand Exhibition Strategy
Brands exhibit to attract distributor and retail partners seeking product partnerships:
- Product differentiation emphasis: Booth and materials emphasize brand positioning, product differentiation, and consumer appeal; brand exhibition is a product market opportunity presentation
- Market validation evidence: Display sales data, review scores, and market performance metrics from existing markets; proven performance attracts partners more than product promise alone
- Partnership terms clarity: Provide clear wholesale pricing, territory terms, and support commitments; partners evaluate brand opportunities through financial clarity, not vague partnership promise
- Consumer marketing materials: Share marketing assets, social media content, and brand story materials that partners can deploy in their territories; marketing support commitment differentiates from brands offering only product
GlobalPetIndex’s trade show calendar provides updated dates, locations, and registration information for pet industry exhibitions worldwide.
Virtual and Hybrid Show Participation
Digital Exhibition Adaptation
Trade shows increasingly incorporate virtual elements:
- Virtual booth platforms: Many shows offer digital exhibition spaces supplementing physical booths; virtual presence extends reach to attendees who cannot visit physical booth
- Digital meeting scheduling: Pre-show digital platforms enable meeting scheduling with targeted attendees; digital scheduling increases meeting quality and quantity
- Post-show digital follow-up: Virtual show platforms maintain attendee access after physical show concludes; extended engagement window increases follow-up opportunity
- Cost-efficient testing: Virtual-only participation enables low-cost market testing before committing to full physical exhibition; test market interest before investing in booth and travel
Trade Show ROI Calculation Framework
Calculate trade show ROI systematically to justify continued participation and optimize investment allocation:
Direct ROI calculation: (Revenue from trade show contacts within 12 months) ÷ (Total trade show investment). Direct ROI range: 2–5x for experienced exhibitors, 1–2x for first-time exhibitors. Direct ROI below 1x indicates either: (a) wrong show selection (audience doesn’t match target market); (b) poor execution (booth design, staff preparation, follow-up insufficient); or (c) unrealistic timeline (B2B pet industry relationships require 6–18 months from introduction to order).
Relationship value ROI: (Value of ongoing relationships initiated at trade show) ÷ (Total investment). Relationship value includes: future orders from contacts, referral business from relationships, market intelligence from conversations, and partnership opportunities from introductions. Relationship value ROI typically exceeds direct ROI by 2–3x because trade show relationships generate compounding business value over multiple years.
Brand exposure value: (Estimated awareness value from show visibility) + (Media coverage value) + (Industry authority perception improvement). Brand exposure value is difficult to quantify precisely but contributes to long-term market position that direct ROI measurement misses. Brands that consistently exhibit at major trade shows develop industry authority perception that reduces future acquisition cost and improves partnership accessibility.
Virtual and Hybrid Trade Show Participation
Virtual and hybrid trade show formats offer complementary participation options:
Virtual show advantages: Lower cost (no travel, shipping, booth rental), broader geographic reach, pre-show audience data availability, meeting scheduling efficiency, and 12-month content availability (virtual booths often remain accessible after event). Virtual show limitations: reduced relationship depth (screen-based interaction creates shallower connection), limited product demonstration (physical product experience impossible), and lower commitment signal (virtual attendance requires less investment indicating lower purchase intent).
Hybrid show optimization: Hybrid shows combining physical and virtual elements offer: (a) physical booth for key relationship development with top-priority contacts; (b) virtual access for broader reach without travel cost; (c) pre-show virtual scheduling that maximizes physical booth meeting quality; (d) post-show virtual follow-up that maintains connection depth beyond the event. Hybrid participation strategy: invest in physical presence at top-priority shows (1–2 per year), supplement with virtual presence at secondary shows (3–4 per year).
Export Strategy: OEM vs. Brand Exhibition Approach
OEM/ODM manufacturers and established brands exhibit differently at trade shows:
OEM/ODM manufacturer exhibition: Focus on production capability demonstration: manufacturing facility videos, equipment photos, quality certification display, production capacity documentation, and sample product portfolio. OEM exhibition objective: attract brand owners seeking manufacturing partnership. OEM exhibition success metrics: number of qualified partnership inquiries, volume of specification requests, and contract negotiation initiations.
Brand exhibition: Focus on product and brand demonstration: product samples, brand story presentation, market success evidence, and distribution partnership opportunity. Brand exhibition objective: attract distributors, retailers, and marketplace partners seeking product addition. Brand exhibition success metrics: number of distribution inquiries, retail placement commitments, and partnership agreement initiations.
Hybrid exhibition: Brands with both manufacturing capability and brand products can exhibit dual capability: manufacturing section attracting OEM partnership inquiries, brand section attracting distribution partnership inquiries. Hybrid exhibition requires clear section separation preventing confusion — visitors must immediately understand whether they’re approaching manufacturing capability or brand opportunity.
Conclusion
International pet trade shows remain the most efficient mechanism for concentrated partner discovery and market intelligence collection — but only when participation is strategically planned, disciplined in execution, and rigorously followed up. The framework in this guide — from show selection through preparation, execution, and follow-up — transforms trade show investment from expensive habit into measurable business development activity.
Whether you are an OEM manufacturer seeking brand clients, a brand seeking distribution partners, or an exporter evaluating market opportunities, trade show strategy that aligns with your specific business objectives produces ROI that justifies the significant investment required.
For additional export guidance, distributor search, and market entry strategy, explore the pet business knowledge hub at GlobalPetIndex and find potential partners in our company directory.
