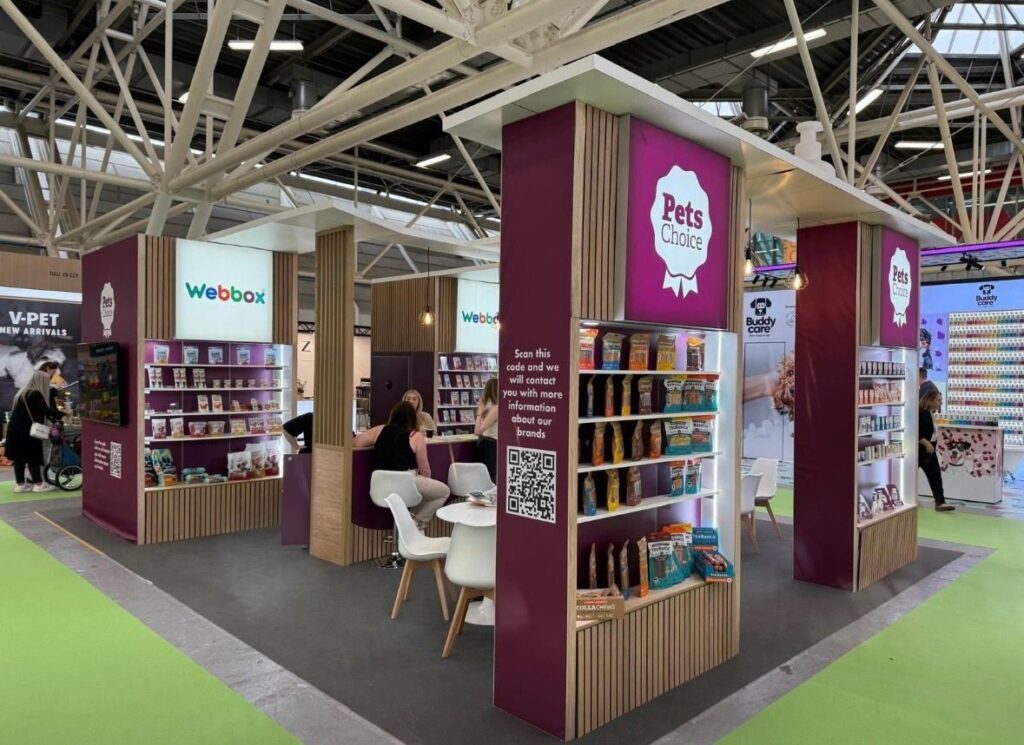
pet retail chain financial performance 2024 — The pet retail sector — encompassing physical specialty stores, e-commerce platforms, and omnichannel hybrids — represents approximately billion in annual revenue across the world’s major chains. This report analyzes the financial performance, competitive strategies, and structural challenges of the leading pet retail operators navigating the industry’s physical-to-digital transformation.
About the pet retail chain financial performance 2024
Pet Retail Financial Overview
Major Retail Chain Performance Summary
| Company | 2024 Revenue | Operating Margin | Net Margin | Format | Growth Rate |
|---|---|---|---|---|---|
| Chewy | ~$12B | ~0% (approaching) | ~0% (approaching) | E-Commerce | 8-10% |
| PetSmart | ~$7B | ~5% | ~2-3% | Physical + Services | 2-3% |
| Petco | ~$4B | ~3% | ~1% | Physical + Services | 0-2% |
| Walmart Pet | ~$3B | varies (portion of Walmart total) | varies | General Retail | 5-8% |
| Amazon Pet | ~$5B | varies (portion of Amazon total) | varies | General E-Commerce | 10-15% |
| Zooplus | ~€2B+ | ~2-3% | ~0-1% | E-Commerce (Europe) | 8-10% |
| Pets at Home | ~£1.5B | ~8% | ~5% | Physical + Services | 3-4% |
| Cobasi-Petz | ~R$2B | ~5-8% | ~3-4% | Physical + Online | 6-8% |
| Fressnapf | ~€500M | ~5-7% | ~3-4% | Physical | 3-5% |
Key Financial Patterns
The financial data reveals clear patterns across retail formats:
- E-commerce platforms (Chewy, Zooplus): higher revenue growth but lower/negative margins — investing in scale before profitability
- Physical + Services retailers (PetSmart, Petco, Pets at Home): moderate growth but improving margins through service integration
- General retailers (Walmart, Amazon): pet products as category within broader business — limited pet-specific financial disclosure
- International specialists (Cobasi-Petz, Fressnapf): moderate growth, moderate margins, regional focus
Chewy — E-Commerce Financial Deep Dive
Revenue Trajectory
| Year | Revenue | YoY Growth | Autoship % | Key Development |
|---|---|---|---|---|
| 2016 | $900M | N/A | 45% | Rapid growth phase |
| 2018 | $3.5B | 67% | 55% | Scale acceleration |
| 2020 | $7.1B | 41% | 60% | COVID surge |
| 2022 | $10.7B | 15% | 65% | Growth normalization |
| 2023 | $11.2B | 4.7% | 67% | Near-breakeven |
| 2024 | ~$12B | ~7% | 70% | Profitability path |
Margin Evolution
| Year | Gross Margin | Operating Margin | Net Margin | Margin Driver |
|---|---|---|---|---|
| 2018 | 24% | -6% | -8% | Scale investment phase |
| 2020 | 27% | -3% | -5% | COVID logistics costs |
| 2022 | 32% | -0.5% | -1% | Margin improvement trend |
| 2023 | 34% | 0% | approaching 0% | First profitable quarter |
| 2024 | 35%+ | 1-2% | 0-1% | Sustained profitability path |
Revenue Composition
Chewy’s revenue has diversified beyond core product sales:
| Category | Share of Revenue | Growth | Margin |
|---|---|---|---|
| Pet Food & Treats | 65% | 5-6% | 25-30% |
| Pet Supplies & Accessories | 20% | 8% | 30-35% |
| Pharmacy & Healthcare | 10% | 15-20% | 40-50% |
| Services (emerging) | 5% | 25% | varies |
Pharmacy is Chewy’s highest-margin category and fastest-growing — representing the company’s strategic pivot toward healthcare as both growth and margin lever.
Strategic Financial Initiatives
- Private label expansion: Chewy-branded products growing from 5% to 10-15% of revenue, improving gross margins 5-8%
- Advertising platform: monetizing site traffic through sponsored placements, high-margin revenue stream
- Pharmacy scale: compounding pharmacy and prescription fulfillment expanding, margin-rich category
- Autoship optimization: subscription revenue increasing average order value 15-20% and reducing churn
- International expansion: Canada launch, evaluating UK/EU markets for geographic revenue growth
Unit Economics
Chewy’s unit economics have improved steadily:
| Metric | 2020 | 2022 | 2024 |
|---|---|---|---|
| Average Order Value | $65 | $75 | $80 |
| Customer Acquisition Cost | $40 | $35 | $30 |
| Customer Lifetime Value | $400 | $500 | $600 |
| LTV/CAC Ratio | 10x | 14x | 20x |
| Annual Purchase Frequency | 6 | 8 | 9 |
| Churn Rate | 25% | 20% | 15% |
The improving LTV/CAC ratio (from 10x to 20x) demonstrates Chewy’s increasing efficiency in customer acquisition and retention — the fundamental driver of its profitability trajectory.
For Chewy IPO context, see Pet Industry IPOs and Public Listings.
PetSmart — Physical Retail + Services Leader
Financial Structure
PetSmart’s financial performance (privately held by BC Partners, limited public disclosure) can be estimated from industry sources:
| Metric | 2024 Estimate | Trend |
|---|---|---|
| Total Revenue | ~$7B | 2-3% growth |
| Product Revenue | ~$5B | 0-1% growth (e-commerce pressure) |
| Service Revenue (grooming, boarding, vet) | ~$1.5B | 5-8% growth |
| Veterinary Revenue (Banfield partnership) | ~$0.5B | 5% growth |
| Gross Margin | ~30% | Stable |
| Operating Margin | ~5% | Stable |
| Net Margin | ~2-3% | Stable |
Service Revenue as Differentiator
PetSmart’s financial strategy centers on services as margin and traffic differentiator:
- Grooming: ~1,600 salons generating approximately $1.5B+ revenue, 30-40% gross margins
- PetsHotel: ~200 locations generating approximately $500M revenue, premium pricing
- Banfield partnership: 1,200+ Banfield clinics inside PetSmart stores generating veterinary revenue and store traffic
- Cross-selling impact: grooming and boarding customers spend 30-40% more on retail during service visits
Services represent approximately 25-30% of PetSmart’s revenue but contribute disproportionately to margins and store traffic — making service investment the company’s primary financial strategy against e-commerce competition.
PE Ownership Financial Implications
BC Partners’ PE ownership creates specific financial dynamics:
- Leveraged buyout structure: significant debt load from 2015 acquisition requiring debt service
- Cash flow priority: debt service constraining reinvestment capacity relative to public competitors
- Chewy spin-off financial impact: PetSmart’s Chewy investment ($3.35B acquisition, subsequent IPO spin-off) generated significant capital return
- Exit consideration: BC Partners evaluating PetSmart exit options (IPO, sale, or continued ownership)
Petco — Health-Focused Retail Turnaround
Financial Performance
| Metric | 2024 | Trend | Comparison |
|---|---|---|---|
| Revenue | ~$4B | Flat | Below Chewy growth rate |
| Gross Margin | ~30% | Stable | Below Chewy (35%) |
| Operating Margin | ~3% | Declining | Below PetSmart (5%) |
| Net Margin | ~1% | Declining | Below PetSmart (2-3%) |
| Same-Store Sales Growth | 0-1% | Flat | Below target |
| E-Commerce Share | 12-15% | Growing | Below Chewy |
Financial Challenges
Petco faces several financial headwinds:
- Margin pressure: e-commerce competition compressing product margins
- Investment cost: service expansion (veterinary, grooming upgrades) requiring significant capital
- Debt load: PE ownership debt from pre-IPO era constraining flexibility
- Revenue stagnation: total revenue flat despite service investment
- Market cap decline: from $6B IPO peak to ~$1.5B current — reflecting investor concern
Turnaround Strategy
Petco’s financial turnaround strategy focuses on:
- Health positioning: “pet health and wellness” branding attempting premium pricing and differentiation
- Veterinary expansion: in-store clinics generating healthcare revenue and store traffic
- Grooming investment: upgraded grooming salons as service differentiator
- Subscription services: repeating revenue models (vital care plans) creating recurring revenue
- Private label: Petco-branded products expanding for margin improvement
The turnaround’s financial success depends on whether service revenue can offset product margin compression — a strategy that requires sustained investment before payoff.
Zooplus — European E-Commerce Economics
Financial Profile
| Metric | 2024 Estimate | Challenge |
|---|---|---|
| Revenue | ~€2B+ | Growing but margin-constrained |
| Gross Margin | ~25% | Below US e-commerce benchmarks |
| Operating Margin | ~2-3% | Low due to logistics complexity |
| Net Margin | ~0-1% | Marginally profitable |
| Countries Served | 30+ | Logistical complexity |
| Average Order Value | ~€45 | Below Chewy ($80) |
European E-Commerce Financial Challenges
Zooplus faces financial challenges specific to European pet e-commerce:
- Cross-border logistics: 30+ country fulfillment creating higher logistics costs than US single-market operations
- Localization cost: product assortment, pricing, and regulatory compliance varying across markets
- Language/localization: 10+ languages requiring localization investment
- Lower AOV: European average order values lower than US, reducing per-order margin contribution
- Amazon competition: Amazon present in each Zooplus market, competing on convenience and price
- National retail competition: Pets at Home (UK), Fressnapf (Germany) offering omnichannel alternatives
Zooplus’s financial trajectory depends on achieving scale efficiency across its pan-European footprint — currently challenged by the operational complexity of serving 30+ markets.
For European context, see Europe Pet Industry Report 2025.
Pets at Home — Integrated Retail Model
Financial Profile
| Metric | 2024 | Performance |
|---|---|---|
| Revenue | ~£1.5B | Stable growth |
| Gross Margin | ~50% | High (services + retail mix) |
| Operating Margin | ~8% | Above pet retail average |
| Net Margin | ~5% | Strong |
| Store Count | ~400 | UK-focused |
| Veterinary Clinics | ~450 (First Vet practices) | Strong integration |
| Grooming Salons | ~300 | In-store |
Pets at Home achieves the highest margins among major pet retailers through its integrated model:
- Retail + veterinary + grooming: each store offering multiple services alongside product retail
- Recurring revenue: veterinary subscription plans and grooming packages creating predictable revenue
- Cross-selling: veterinary and grooming customers spending more on retail products
- UK market dominance: limited geographic scope enabling market saturation and efficiency
This integrated model demonstrates that pet retail’s financial future lies in service integration — not product-only retail that faces e-commerce margin compression.
Financial Trend Analysis
Physical vs. Digital Retail Margin Comparison
| Metric | Physical Retail | E-Commerce | Omnichannel |
|---|---|---|---|
| Gross Margin | 28-32% | 33-35% | 30-33% |
| Operating Expenses | 25-30% (rent, labor, store ops) | 28-32% (fulfillment, marketing, tech) | 27-30% |
| Operating Margin | 2-5% | 0-3% | 3-6% |
| Net Margin | 1-3% | 0-1% | 2-4% |
| Capital Requirements | High (store build-out) | High (fulfillment centers) | High (both) |
| Service Revenue Potential | High (in-store) | Low | Moderate |
| Recurring Revenue Potential | Moderate (services) | High (autoship) | High (both) |
The financial comparison reveals that pure physical retail and pure e-commerce face different margin challenges — physical retail suffers from rent and labor costs while e-commerce suffers from fulfillment and marketing costs. Omnichannel models that combine physical services with digital subscription appear to achieve the best margin outcomes.
Service Revenue Margin Premium
Services consistently achieve higher margins than product retail:
| Service | Gross Margin | Operating Margin | Net Margin |
|---|---|---|---|
| Grooming | 60-70% | 15-25% | 10-20% |
| Veterinary (in-store) | 50-60% | 10-15% | 5-10% |
| Boarding | 50-60% | 10-20% | 5-15% |
| Training | 70-80% | 20-30% | 15-25% |
| Product Retail | 28-32% | 3-5% | 1-3% |
Service revenue’s gross margins are 2-3x higher than product retail — making service integration the clearest margin improvement strategy for physical retailers.
Competitive Financial Strategy Comparison
| Strategy | Company | Financial Goal | Key Investment |
|---|---|---|---|
| Scale-first, profit-later | Chewy | Revenue growth → eventual profitability | Fulfillment, autoship, pharmacy |
| Service differentiation | PetSmart | Service revenue offsetting product margin decline | Grooming, boarding, veterinary |
| Health positioning | Petco | Premium pricing through wellness branding | Veterinary, grooming, vital care |
| Integrated local model | Pets at Home | Maximum margin through service integration | In-store vet, grooming, subscription |
| Pan-European scale | Zooplus | Cross-border scale efficiency | Logistics, localization |
| Omnichannel hybrid | All | Physical services + digital convenience | Store pickup, online booking |
Capital Efficiency Analysis
Capital efficiency varies dramatically across pet retail models:
| Metric | Chewy | PetSmart | Petco | Pets at Home | Zooplus |
|---|---|---|---|---|---|
| Revenue per employee | $380K | $210K | $160K | $160K | $330K |
| Revenue per square foot | N/A | $380 | $280 | £375 | N/A |
| Capex per $1 revenue | $0.04 | $0.12 | $0.10 | £0.08 | €0.06 |
| Return on invested capital | Improving toward 10% | 15-20% (PE-owned) | 5-8% (turnaround) | 18-22% | 6-8% |
| Inventory turnover | 8x/year | 5x/year | 4x/year | 6x/year | 7x/year |
Chewy achieves the highest revenue per employee due to e-commerce’s labor efficiency but requires significant fulfillment infrastructure investment. Pets at Home achieves the highest return on invested capital through service integration and market saturation. Petco’s low returns reflect ongoing turnaround investment.
Private Label Financial Impact
Private label products are expanding across all pet retailers as a margin improvement strategy:
| Retailer | Private Label Share | Private Label Margin | Growth Rate |
|---|---|---|---|
| Chewy | 5-8% (growing) | 45-55% gross margin | 20%+ |
| PetSmart | 10-15% | 40-50% gross margin | 8-10% |
| Petco | 15-20% | 40-50% gross margin | 10-12% |
| Pets at Home | 20-25% | 45-55% gross margin | 5-8% |
| Zooplus | 5-8% | 40-50% gross margin | 12-15% |
Private label products generate 10-20% higher gross margins versus branded products, making them a critical margin lever. However, private label expansion must be balanced against brand relationship management — excessive private label growth can alienate key brand partners who provide both product supply and marketing support.
Pharmacy Revenue Growth
Pet pharmacy is emerging as a margin-rich revenue category for retailers:
- Chewy Pharmacy: approximately $500M revenue, growing at 25%+ — compounding pharmacy capability differentiating from competitors
- PetSmart/VCA integration: veterinary pharmacy revenue flowing through integrated clinic-pharmacy system
- Petco veterinary pharmacy: growing with in-store veterinary expansion
- 1-800-PetMeds: standalone online pharmacy, approximately $300M, facing Chewy competition
Pharmacy revenue’s higher margins (40-50% gross) and veterinary relationship depth create both a financial and competitive advantage. Companies that successfully integrate veterinary services with pharmacy fulfillment will achieve the most profitable revenue composition.
Future Financial Outlook
2025-2030 Financial Trajectories
| Company | Revenue (2030 proj.) | Margin (2030 proj.) | Key Financial Risk |
|---|---|---|---|
| Chewy | $18-20B | 3-5% net margin | Growth rate deceleration, competition |
| PetSmart | $8-9B | 4-5% net margin | E-commerce margin pressure |
| Petco | $4-5B | 2-3% net margin | Turnaround execution risk |
| Zooplus | €3-4B | 2-3% net margin | Cross-border logistics cost |
| Pets at Home | £1.8-2B | 5-6% net margin | UK market saturation |
Key Financial Trends
- Service integration accelerating: all physical retailers investing in service revenue as margin lever
- E-commerce profitability proving: Chewy demonstrating pet e-commerce can achieve profitability
- Private label expanding: all retailers developing private-label products for margin improvement
- Pharmacy growth: pet pharmacy becoming significant margin-rich revenue category
- Subscription models scaling: autoship, wellness plans, and service subscriptions creating recurring revenue
For broader market context, see Pet Industry Forecast 2025-2030 and Pet E-Commerce Industry Analysis.
Conclusion
Pet retail financial performance reveals a sector in structural transformation — physical retail facing e-commerce margin pressure, e-commerce facing profitability challenges, and the most successful models integrating physical services with digital convenience.
Chewy’s approaching profitability validates pet e-commerce’s financial model. Pets at Home’s margin leadership validates service integration. Petco’s margin challenges validate the risk of physical-only retail without sufficient service differentiation.
The next five years will see continued e-commerce growth, continued physical retail service investment, and increasing omnichannel integration. Companies that achieve the optimal balance of digital convenience, physical service delivery, and recurring revenue will generate the strongest financial performance in pet retail’s evolving competitive landscape.
For ongoing retail financial tracking, continue exploring the GlobalPetIndex Industry Reports library.
